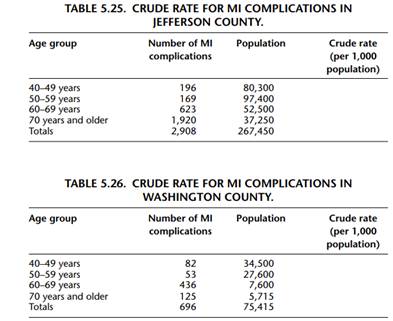
Tables 5.25 and 5.26 present data for the number of inpatient complications due to myocardial infarction during 2003 in Jefferson County, the service area for East Bank Regional Hospital, and Washington County, the service area for Westside Memorial Hospital.
a. Using these data, calculate age-specific inpatient MI complication rates for the two counties per 1,000 population.
b. Compare age-specific complication rates between Jefferson and Washington Counties. Which county has the higher age-specific complication rates?
c. Describe the general pattern of the change in complication rate with age.
d. Calculate the crude complication rate for Jefferson and Washington Counties for 2003.
e. What is the ratio of the crude complication rate in Jefferson County to that in Washington County?
f. Do you draw the same conclusion about the complication rates in Jefferson County versus Washington County when you compare age-specific rates as you do when you compare crude complication rates?
g. What do these age-specific rates indicate with respect to policy and planning for hospital services?
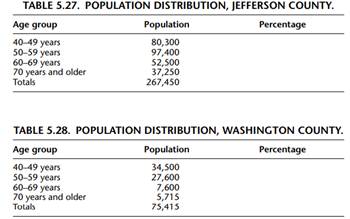
h. The data presented in Tables 5.27 and 5.28 indicate that the population distributions of Jefferson and Washington Counties are quite different. Calculate the percentage of the population in each age group in both populations, and fill in the tables.
I. Based on the preceding calculations, what is the difference between the two counties with respect to their age distributions?
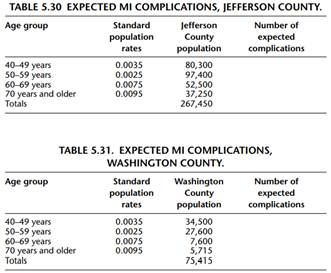
j. Before single summary rates between the two counties can be compared, complication rates must be adjusted for differences in age distribution. Using the data in Table 5.29, perform indirect adjustment of crude complication rates. The first step is to select a standard population and its MI rates. The standard population selected is the 2000 U.S. population. The second step is to calculate the expected number of complications in each age group. This is accomplished by
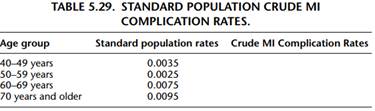
Multiplying the number of persons in each age category in the study populations (Jefferson and Washington Counties) by the rates of MI in each age category in the standard population. Complete Tables 5.30 and 5.31. Finally, calculate the standardized morbidity ratio for Jefferson and Washington Counties by dividing the observed cases by the number of expected cases:
k. Discuss the difference in SMR for Jefferson and Washington Counties. What does this difference indicate to you?