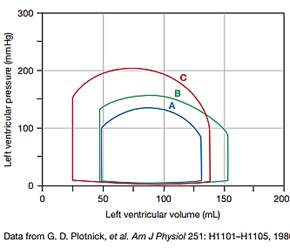
The following graph shows left ventricular pressure-volume curves in one individual. Curve A is the person sitting at rest. Curve B shows the person’s cardiac response to mild exercise on a stationary bicycle. Curve C shows the cardiac response during maximum intensity cycling.
a. Calculate the stroke volume for each of the curves.
b. Given the following cardiac outputs (CO), calculate the heart rates for each condition. COA = 6 L/min, COB = 10.5 L/min, COC = 19 L/min

c. Which exercise curve shows an increase in stroke volume due primarily to increased contractility? Which exercise curve shows an increase in stroke volume due primarily to increased venous return?
d. Mechanistically, why did the end-diastolic volume in curve C fall back toward the resting value?

