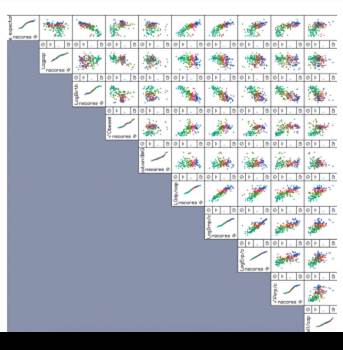
Here is a scatterplot matrix of the variables as re-expressed in using a version that places Normal probability plots on the diagonal. a) Comment on their suitability for a regression model to predict Life expectancy. The points are colored according to values of Life expectancy.


b) Here is a correlation table for the variables graphed in in the scatterplot matrix. Suppose we want to build a regression model to predict Life expectancy from some of the other variables. Which predictors might you try? Do you see any potential problems we should be alert for? (Use both the correlations and the scatterplot matrix in your discussion.)

