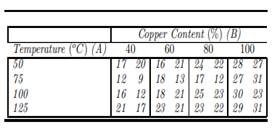
The data in the below come from an experiment to determine the amount of warping (the response variable) in a metal plate as a function of the following two factors: (A) temperature (measured in degrees Celsius), and (B) copper content (measured as a percentage). (a) Compute the estimated cell means and display your results in the format. (b) Plot the estimated cell means (i, yij.)(i = 1,…, 4) for each concentration of copper in the format. Does the graph support or refute the assumption that there are no interactions between the temperature and copper content of the metal plate? (c) Test for the existence of interactions and main effects by computing the two-way ANOVA .

(Source: N. L. Johnson and F. C. Leone (1964), Statistics and Experimental Design, vol. II, p. 98, John Wiley Press, Inc. Used with permission.)

