As part of research into the impact of television advertising on donations by credit card to a major disaster appeal, data have been collected on the number of viewers reached and the number of donations each day for the past two weeks.
a Which diagram or diagrams would you use to explore these data?
b Give reasons for your choice.
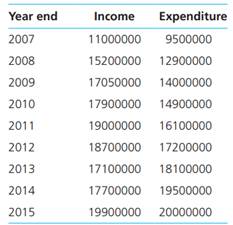
a Which measures of central tendency and dispersion would you choose to describe the Park Trading Company’s income (Question 12.1) over the period 2007–15?
b Give reasons for your choice.
Question 12.1- The following secondary data have been obtained from the Park Trading Company’s audited annual accounts:

a Which are the variables and which are the cases?
b Sketch a possible data matrix for these data for entering into a spreadsheet.

