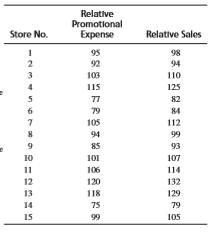
1. A major supermarket chain wants to determine the effect of promotion on relative competitiveness. Data were obtained from 15 states on the promotional expenses relative to a major competitor (competitor expenses = 100) and on sales relative to this competitor (competitor sales = 100).

You are assigned the task of telling the manager whether there is any relationship between relative promotional expense and relative sales.
a. Plot the relative sales (y-axis) against the relative promotional expense (x-axis), and interpret this diagram.
b. Which measure would you use to determine whether there is a relationship between the two variables? Explain.
c. Run a bivariate regression analysis of relative sales on relative promotional expense.
d. Interpret the regression coefficients.
e. Is the regression relationship significant?
f. If the company matched the competitor in terms of promotional expense (if the relative promotional expense was 100), what would the company’s relative sales be?
g. Interpret the resulting r2.
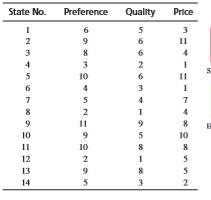
2. To understand the role of quality and price in influencing the patronage of drugstores, 14 major stores in a large metropolitan area were rated in terms of preference to shop, quality of merchandise, and fair pricing. All the ratings were obtained on an 11-point scale, with higher numbers indicating more positive ratings.

a. Run a multiple regression analysis explaining store preference in terms of quality of merchandise and pricing.
b. Interpret the partial regression coefficients.
c. Determine the significance of the overall regression.
d. Determine the significance of the partial regression coefficients.

