In 2007, Carol wanted to invest in the shares of several companies but was unsure when would be the best time to buy. She could not predict how share prices would move in future, but now with hindsight she can see how her strategies would have worked out.
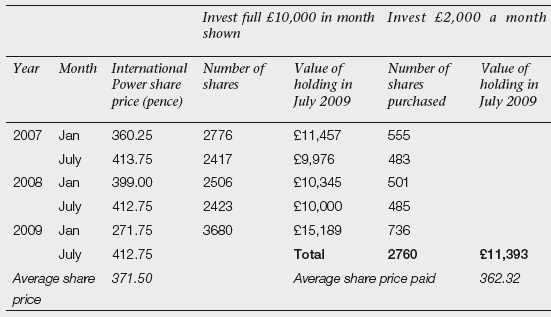
Take just one of the companies, International Power. Table 10.3 shows International Power’s share price at six-monthly intervals during the period 2007 to 2009. Carol had £10,000 to invest in this company. If she had invested the full £10,000 in one go, she would have done best if she had waited and invested in January 2009. She would then have picked up the shares cheaply, paying 271.75p per share and six months later her holding would have been worth £15,189. The worst month to buy would have been July 2007 when the price hit a peak of 413.75p per share. By July 2009, Carol’s shares would have been standing at a loss and valued at £9,976. If instead, Carol had ignored timing and invested £2,000 every six months, by July 2009, she would have 2,760 shares valued at £11,393. While this is not as good as the gain she would have made investing the whole sum in January 2009, it is a good deal better than the loss she would have made investing in July 2007. The pound-cost-averaging enthusiasts claim the alchemy of the regular investments is paying an average price for the shares of £10,000/2,760 = 362.32p which is less than the average share price over the period of (360.25 + 413.75 + 399.00 + 412.75 + 271.75)/5 = 371.50.
Table 10.3 Example of pound cost averaging


