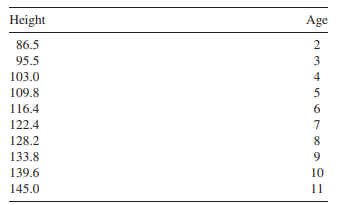
The following questions use this table, which can be downloaded here in Excel format in girls.xls. These data are the heights (in cm) of girls of different ages (in years). For the following questions, you may use software of your choice. (Our source is Siegel and Morgan, Statistics and Data Analysis: An Introduction, 2nd. ed., John Wiley and Sons, 1996. Their source is the 1980 World Almanac).
(a) Find the least squares regression equation for predicting height from age.
(b) Interpret the regression coefficients in terms of the growth of girls.
(c) Use the regression equation to predict the “height” of a 100-year-old “girl.” Comment on the result.
(d) Plot the residuals from the regression against age. (You may plot standardized residuals if your software prefers those, and you may plot versus predicted height if your software likes to do that.) Do you see anything in the residual plot that was not obvious in the original scatterplot?
(e) Produce boxplots (same as box and whiskers plots) of x and y separately; you can use Box Sampler or StatCrunch. Comment on whether the distributions are mostly symmetric or asymmetric.