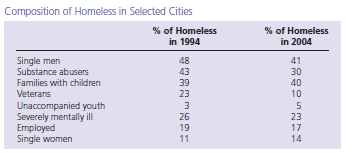
Exercises 1–5. A profile of the homeless in 27 selected cities, according to data compiled by the U.S. Conference of Mayors for 2004, is given in the following table.

1. What was the decrease in the percent of homeless who are veterans over the 10-year period?
2. Which of the categories increased over the 10-year period and which decreased?
3. Explain why each column does not add up to 100%.
4. What percent of the homeless were single men or single women in 1994? Did this percent increase or decrease in 2004?
5. Did the total number of homeless increase or decrease over the 10-year period?

